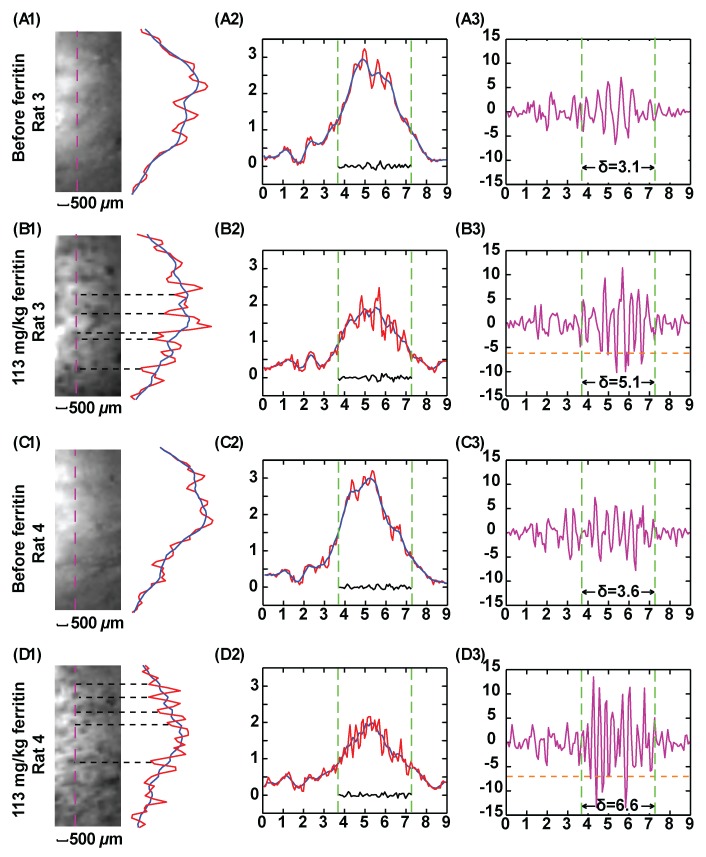
Figure 4:
T2*-weighted GRE kidney images acquired with parametric amplification (58/10, 20° flip angle, 9 × 9 mm2 FOV, 0.2 mm section thickness, 70 × 70 μm2 in-plane resolution, 40 signals acquired; experiment time, 5.8 min). Column 1 images show 3.5 × 1.5 mm2 region of interest approximately 0.5 mm away from the edge of the resonator. Column 2 shows one-dimensional intensity profiles along pink dashed line defined in the region of interest. Red = unsmoothed profile, blue = smoothed profile. Smoothing was done by averaging image intensity over seven adjacent pixels. One-dimensional intensity profiles are displayed along an extended region of 9 mm. Green dashed line = vertical boundary of the region of interest. Column 3 shows DNR for each one-dimensional intensity profile in column 2, obtained by dividing the difference between image intensity for each pixel and the local average with the noise floor as defined in Figure 3. For each plot, standard deviation of DNR is evaluated within the region of interest defined by the green line. The threshold (dashed orange) lines in B3 and D3 are defined by twice the standard deviation in A3 and C3, respectively. The peaks below the threshold lines in B3 and D3 are labeled by black dashed lines in B1 and D1. These peaks correspond to glomeruli spots darkened by cationized ferritin that specifically bind to the basement membrane.

