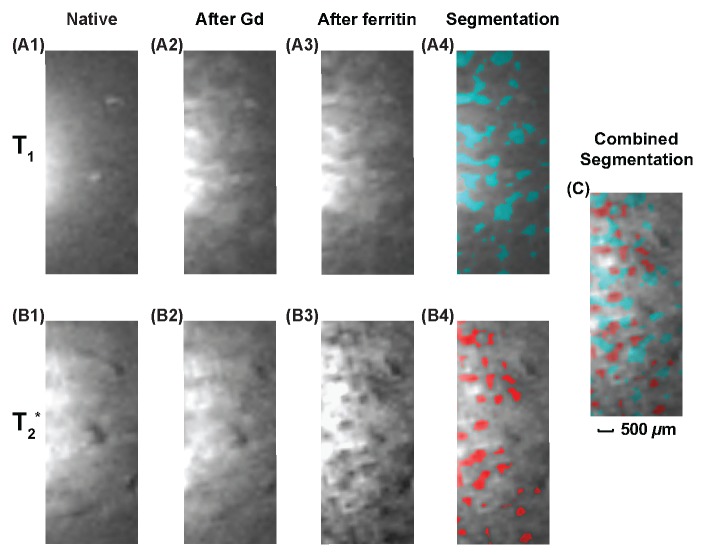
Figure 5:
Kidney images obtained with the combined use of gadopentetate dimeglumine and cationized ferritin. Top row: T1-weighted images (37.4/3.6, 40° flip angle, 9 × 9 mm2 FOV, 0.2 mm section thickness, = 70 × 70 μm2 in-plane resolution, 40 signals acquired; experiment time, 3.2 min). Bottom row: T2*-weighted GRE images (58/10, 20° flip angle, remaining parameters as for T1-weighted images; experiment time, 5.8 min). A first set of images was acquired before injection of contrast agents (column 1). A second set was acquired after injection of gadopentetate dimeglumine at a bolus of 5 μmol/kg (column 2). A third set was acquired after subsequent injection of cationized ferritin at a bolus of 113 mg/kg (column 3). Green regions in A4 have DNR greater than twice the standard deviation of DNR in A1, and red regions in B4 have DNR ratio more negative than twice the standard deviation of DNR in B1. C, Image is overlaid view of A4 and B4, which is indicative of the interleaved distribution pattern of glomeruli and renal tubules.

