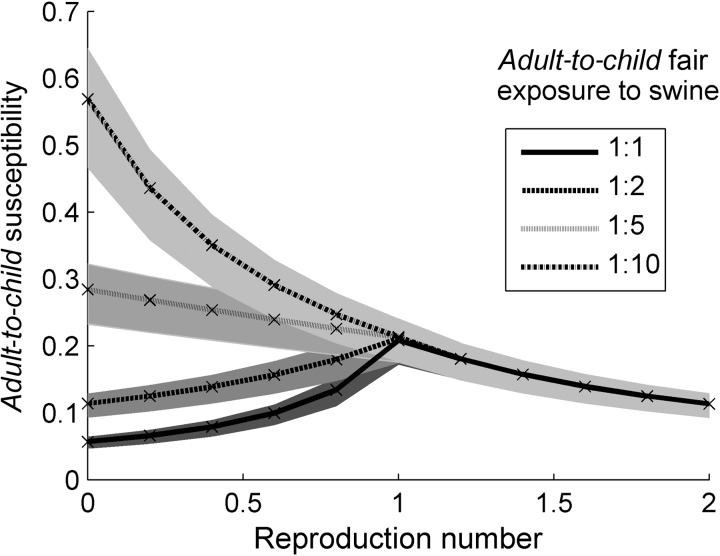
Figure 3.
Variation in the calculated susceptibility ratio between adults and children. We set the model-generated adult-to-child case ratio to the observed case ratio of 1:6.5; the reproduction number is increased from zero for each of the 4 swine exposure scenarios (see legend inset). At R = 0, the case distribution is generated purely by swine exposure and the 4 curves corresponding to the different degrees of swine exposure are clearly demarcated. As R increases, swine exposure becomes less relevant until it is entirely irrelevant as R > 1, when cases are overwhelmingly generated through human-to-human transmission. Shaded regions indicate 95% confidence intervals.

