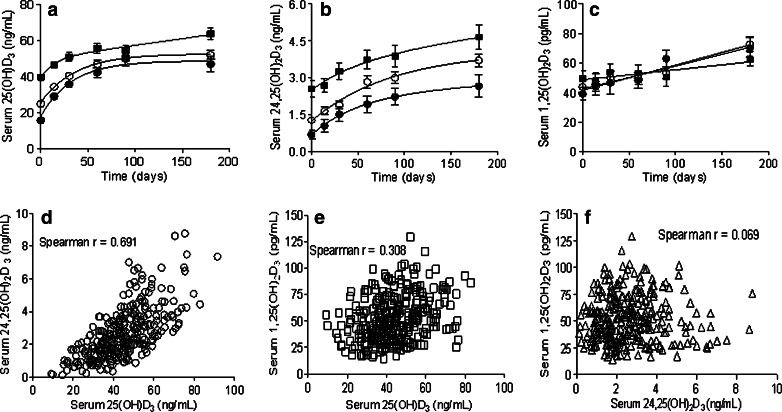
Fig. 1.
Time course of the changes in serum 25(OH)D3 (panel a), 24,25(OH)2D3 (panel b), and 1,25(OH)2D3 (panel c) levels in vitamin D3 deficient (filled circle), insufficient (open circle), and sufficient (filled square) CRC patients receiving 2000IU of oral cholecalciferol daily. Vitamin D3 status stratification based on baseline serum 25(OH)D3 levels: deficient < 20 ng/mL (N = 9), insufficient 20 to 31.9 ng/mL (N = 24) and sufficient ≥ 32ng/mL (N = 17). Panels d, e, and f show plots (and correlation coefficients) of serum 25(OH)D3 versus 24,25(OH)2D3, 25(OH)D3 versus 1,25(OH)D3, and 24,25(OH)2D3 versus 1,25(OH)D3 levels at baseline and during D3 supplementation. Caption in panel a, also refers to panels b and c

