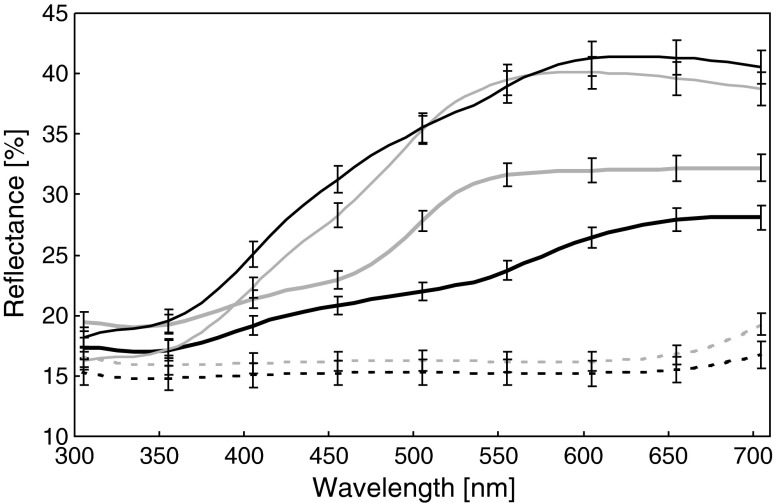
Fig. 2.
Mean (± SE) reflectance spectra of the morphs of Cepaea nemoralis shells. The black thick solid line is P0, the black thin solid line is the shell background of P5, the black dotted line is the bands of P5, the gray thick solid line is Y0, the gray thin solid line is the shell background of Y5, and the gray dotted line is the bands of Y5. For morph names, see the “Materials and methods” section

