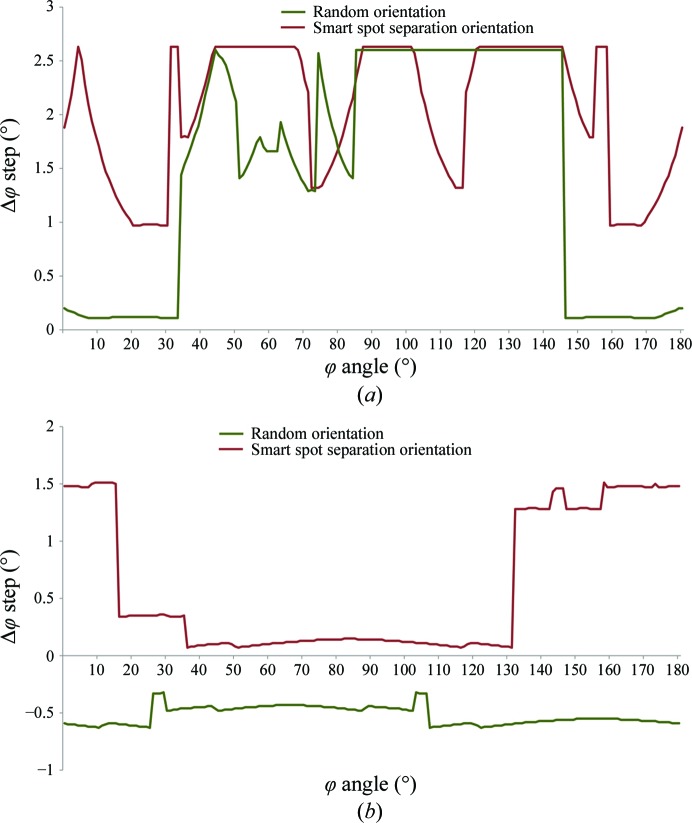
Figure 7.
Plot of the maximal oscillation width possible to avoid overlapping spots as calculated using BEST (Bourenkov & Popov, 2010 ▶) (a) for a deliberately misaligned thaumatin test crystal at 1.4 Å resolution and (b) for a 70S ribosome test crystal at 3.8 Å resolution.

