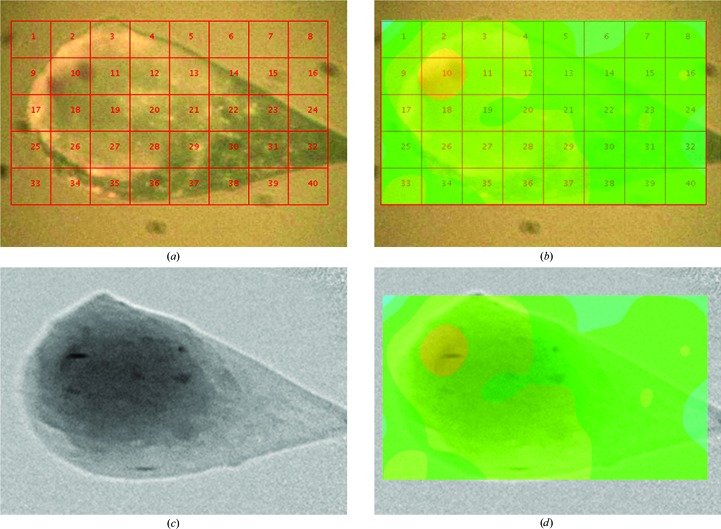
Figure 3.
View of the membrane protein crystal bacteriorhodopsin in lipid cubic phase mounted on a nylon loop (a) with the grid-scan set up for data collection, (b) the results of the good Bragg candidates from the grid-scan calculated using DISTL (Zhang et al., 2006 ▶) overlaid on the sample image, (c) the same orientation of the sample viewed as a radiograph and (d) the grid-scan results overlaid on the radiograph. The grid-scan and the radiograph both demonstrate how they can be used for determination of the sample location and both results map well, as can be seen in (d). The radiograph in (c) provides more information about the crystal size and shape which can then be used to allow better decision-making at the beamline for the diffraction experiment.

