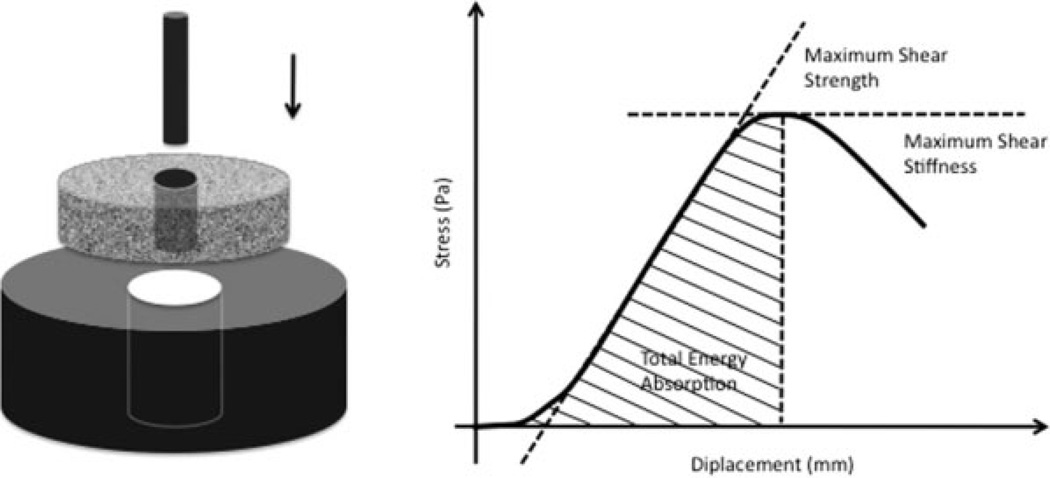
Figure 2.
Mechanical testing. Left: Axial push-out test with specimen placed on metal platform with central opening. Specimen thickness = 3.5 mm, implant θ = 6 mm, support hole θ = 7.4 mm, preload = 2N, Displacement velocity 5 mm/min. Right: Load (Pa) displacement (mm) curve enables calculation of ultimate shear strength (MPa), apparent shear stiffness (MPa/mm), and total energy absorption (J/m2).

