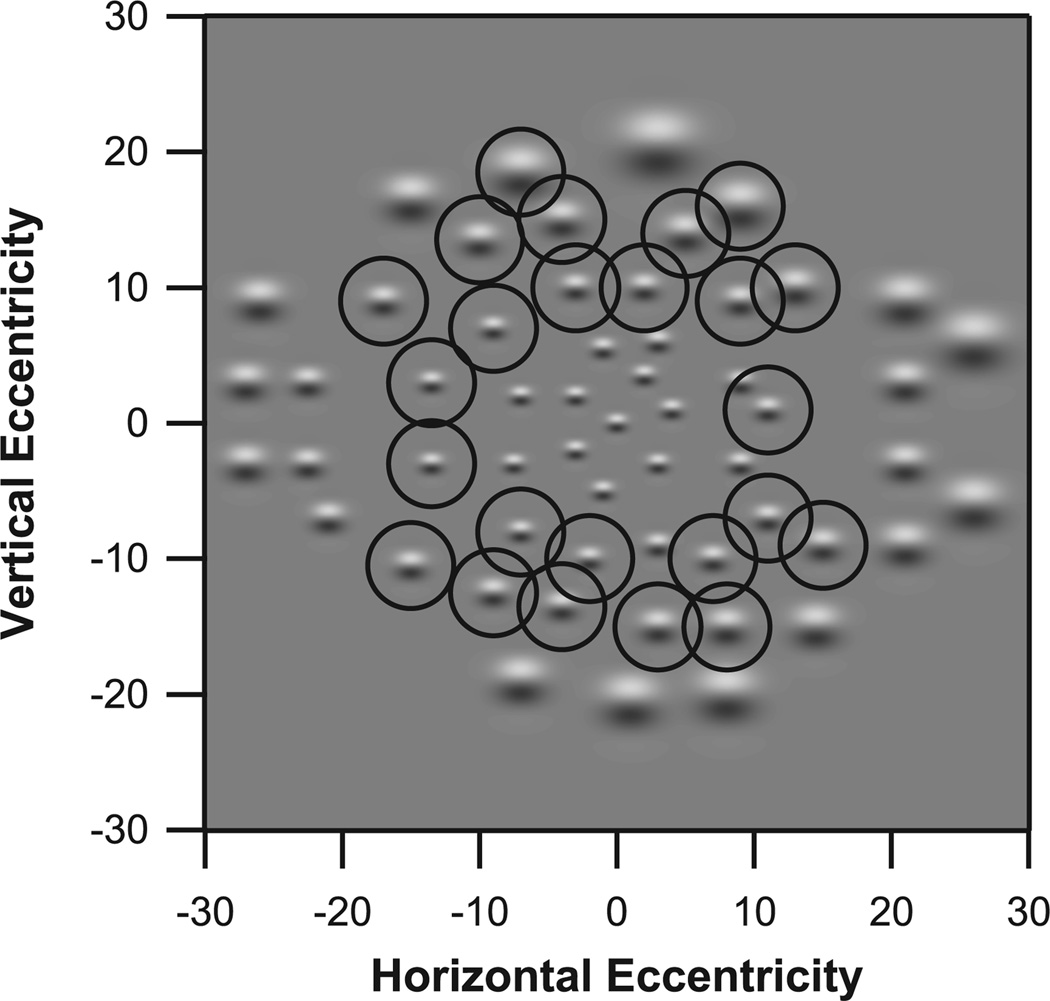
Figure 2.
Stimuli and test locations for the 56 stimuli in Experiment 3, with peak spatial frequencies from 0.14 to 0.5 cpd. The right eye presentation is shown. The stimulus at fixation has a peak spatial frequency of 0.5 cpd, and is identical to the second stimulus from the top in Figure 2. At other locations, stimuli are magnified versions of this stimulus. Circles indicate stimuli contained in Ring 2 (10° to 20°).

