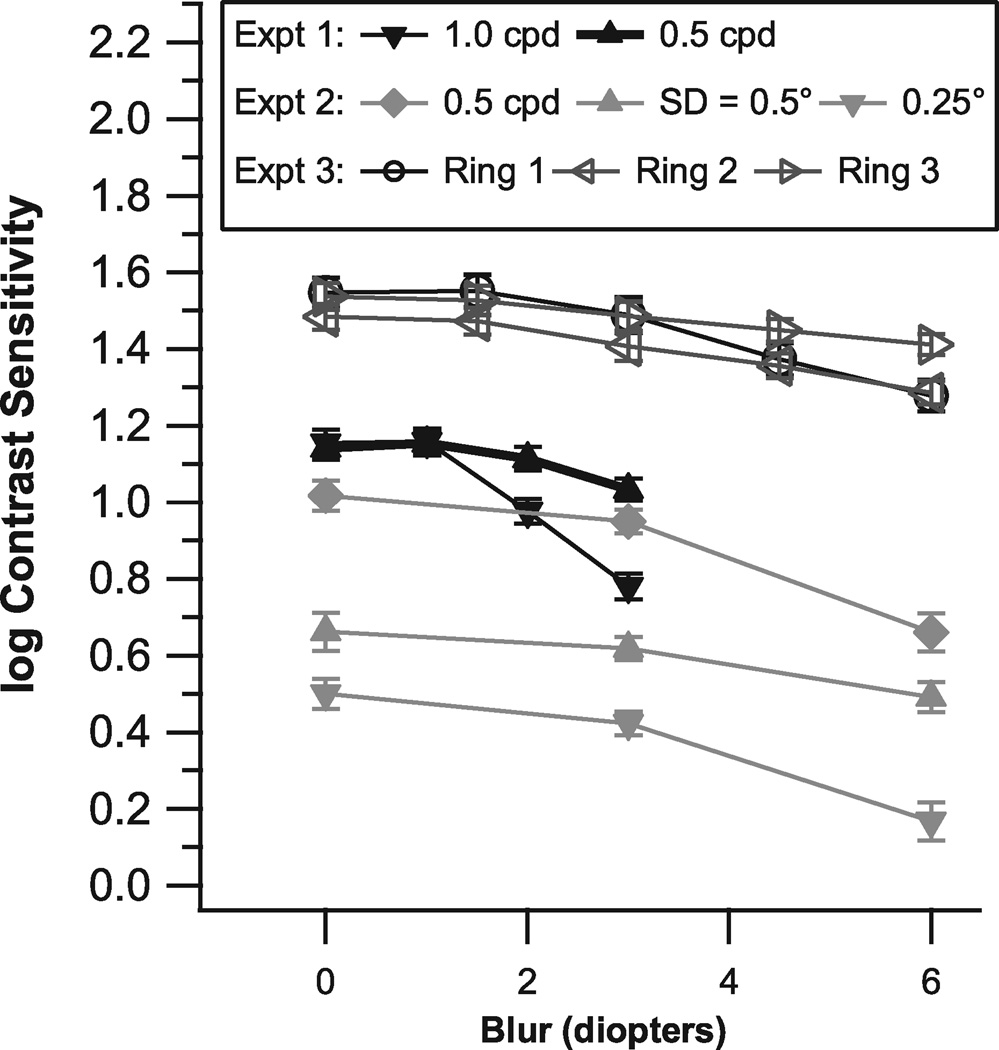
Figure 3.
Mean log contrast sensitivity and standard error across subjects for each of the three experiments, as a function of blur condition. The mean for all locations was computed for each blur condition for experiments 1 & 2, and for Experiment 3 the mean was computed across locations in each ring.

