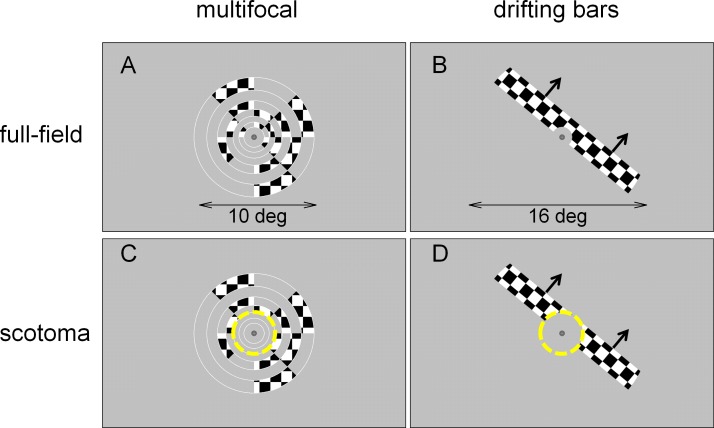
Figure 1.
Stimuli. Panels A and B show an individual frame of the multifocal and the drifting bars stimulus sequences in the full-field condition (arrows in panel B and D indicate the direction of bar motion). Panels C and D show the same frame for the scotoma condition, with the yellow dashed circle (not part of the display) marking the extent of the mean luminance mask simulating a foveal scotoma.

