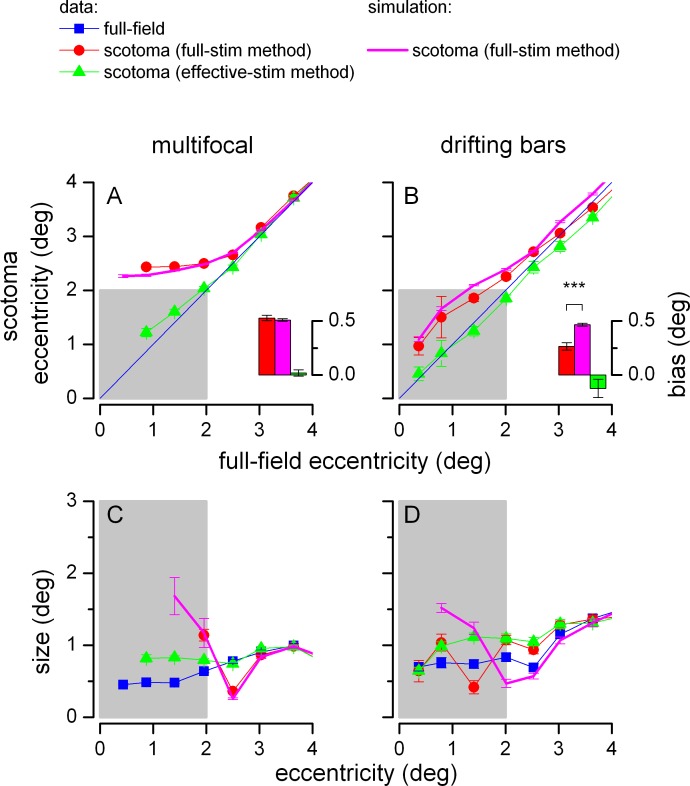
Figure 6.
Comparison of pRFs from the full-field and the scotoma condition. Separate panels show results for the multifocal (A and C) and drifting bars stimulus sequence (B and D). The gray shadow represents the scotoma region. Panels A and B plot the eccentricity of pRFs from the scotoma condition against the eccentricity of pRFs from the full-field condition. Inset bar graphs show the median eccentricity difference between pRF eccentricity in the scotoma and full-field conditions (voxels with full-field pRFs between 1.5° and 2.5°; ***p < 0.001). Panels C and D plot the size of pRFs obtained in each condition and with each analysis method against the respective eccentricity. Voxels were pooled across subjects and binned into contiguous 0.5° bins; symbols report medians in each bin and error bars show SEM.

