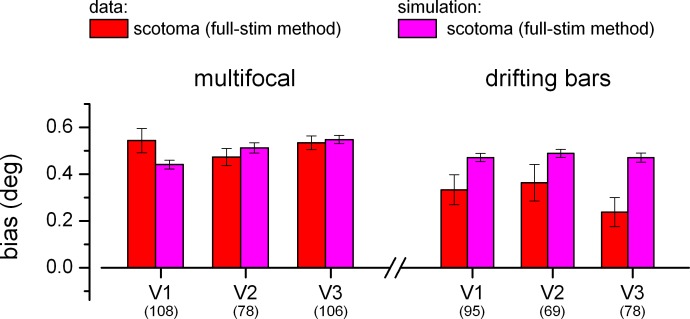
Figure 7.
Comparison of predicted and observed pRFs shifts across ROIs. Bar graphs adopt the same format as the inset in Figure 6A and B, showing the median eccentricity difference between pRF eccentricity in the scotoma and full-field conditions (voxels with full-field pRFs between 1.5° and 2.5°), for the simulations and the pRF estimates obtained with the full-stimulus pRF method. For each ROI, parentheses give the number of voxels included in the analysis in each ROI and for each stimulus sequence (this is different than in Figures 4 and 6, where the sample of analyzed voxels was the same for the two stimulus sequences).

