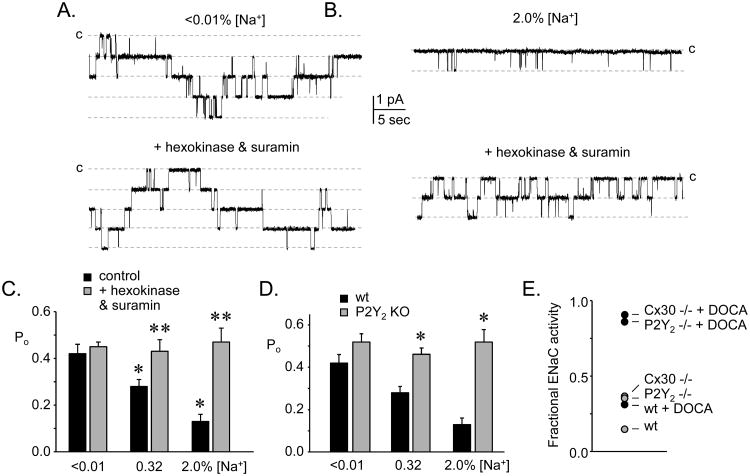
Figure 3. Purinergic inhibition of ENaC allows this channel to respond appropriately to sodium balance.
Single channel current traces of ENaC in cell attached patches on ASDN isolated from mice maintained on a sodium free (A) and a high sodium diet (B) without (top) and with (bottom) addition of suramin plus hexokinase to the bathing solution. Inward current is downward with closed state noted with C. *significant decrease compared to sodium free (<0.01%) condition; **significant increase compared to control. Data originally presented in [9]. C. Summary graph showing the effects on ENaC activity of suramin plus hexokinase (gray bars) as compared to basal activity (black bars) in ASDN from mice fed a sodium free, regular sodium and high sodium diet. *significant increase compared to wild-type under identical feeding conditions. Data originally presented in [9]. D. Summary graph comparing ENaC activity in ASDN from wild-type (black bars) versus P2Y2 receptor knockout (gray bars) mice maintained with sodium free, regular sodium and high sodium diets. Data originally presented in [9]. E. Summary graph showing fractional ENaC activity (activity with high sodium feeding / activity with sodium free feeding) in wild-type (wt) and P2Y2 receptor and Cx30 knockout mice in the absence (gray circles) and presence (black circles) supplementing with DOCA. Activity calculated as fNPo where f is the frequency of observing at least one active ENaC in a patch, N is the mean number of ENaC per patch that contained active channels, and Po is open probability. Data originally presented in [10] and [22].

