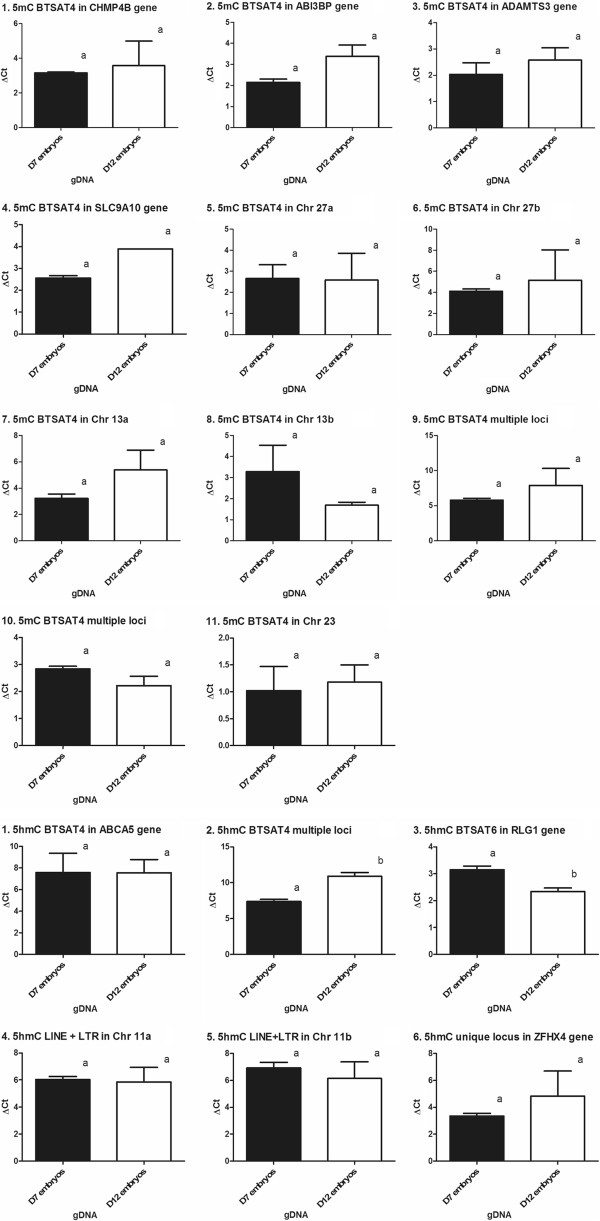
Figure 6.
Inter-stage comparison of methylation/hydroxymethylation status of selected subsets of loci. Aliquots of samples were digested using either mark-sensitive or insensitive enzymes. The differences in amplification rates relates to the methylation (5mC or 5hmC) status. Different letters means statistically significant value P < 0.05.

