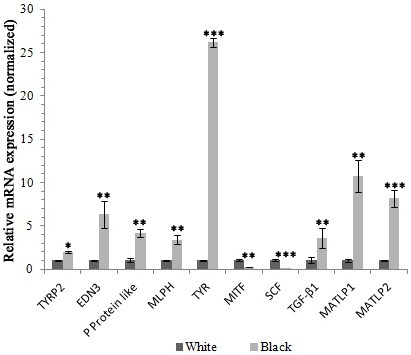
Figure 5.

Real time PCR validation of differentially expressed genes in black versus white sheep skin. Abundance of target genes was normalized relative to abundance of â-actin gene. Bars in each panel represent the mean ± standard error (n = 3), * P < 0.05; ** P < 0.01; *** P < 0.001.
