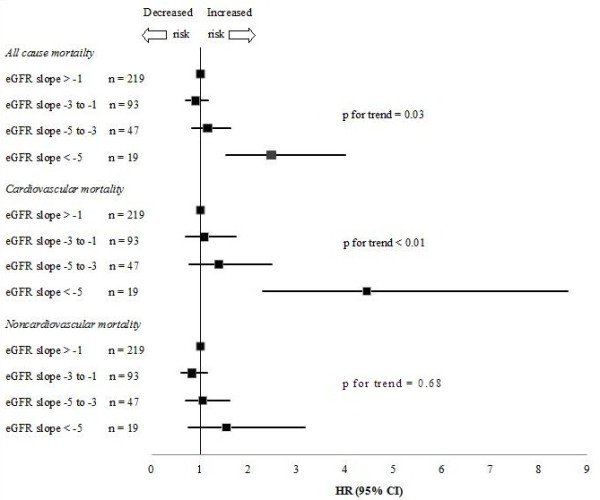
Figure 2.

All-cause, cardiovascular and non-cardiovascular mortality depending on the change in the eGFR per year among 378 participants aged 88 years at baseline expressed as hazard ratios (HR) adjusted for gender with 95% CIs. Values greater than 1.0 indicate an increased risk.
