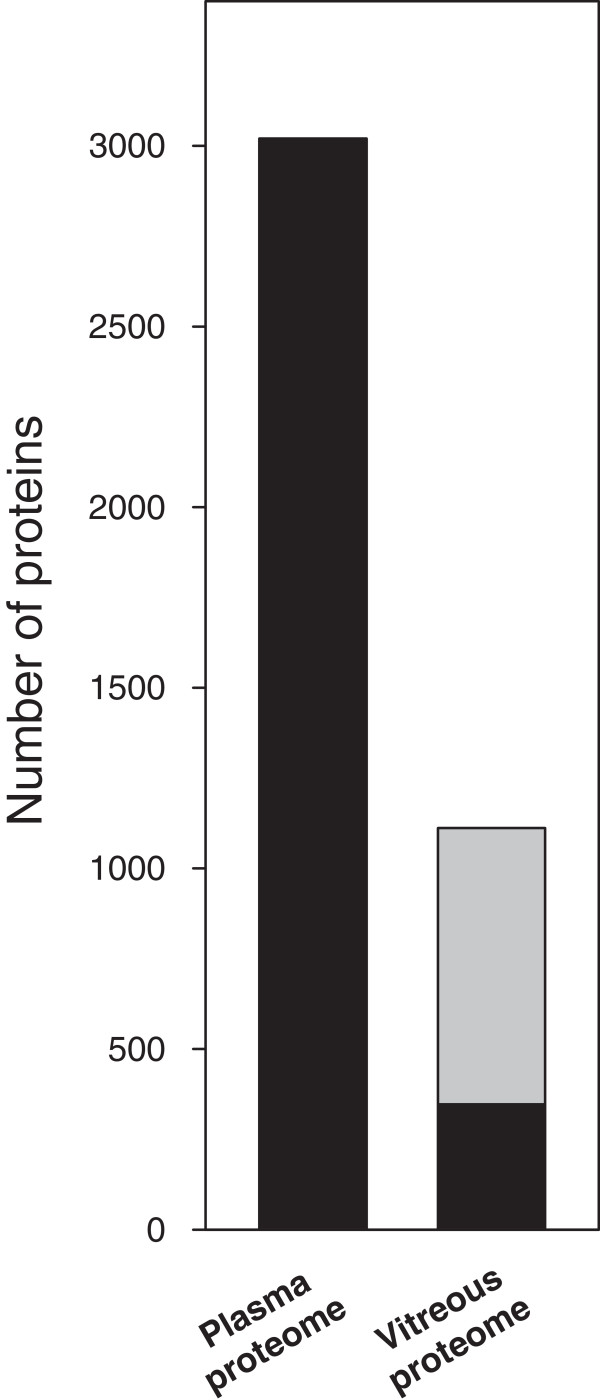
Figure 6.
Comparison of vitreous proteome with plasma proteome. The list of vitreous proteins obtained in our study is compared to a map of plasma proteins from the human proteome project. The black part of the bar representing the vitreous proteome indicates proteins that are also found in the plasma proteome map. The grey part indicates proteins not listed for the plasma proteome.

