Figure 1.

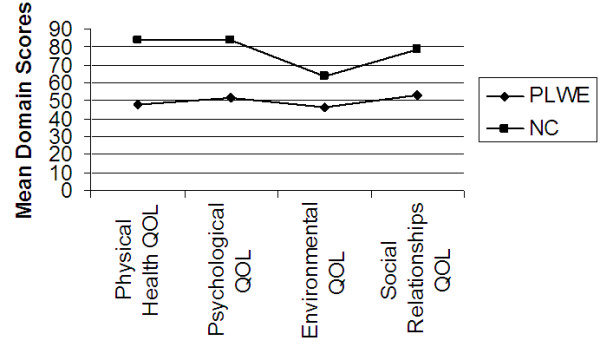
Mean domain scores as determinants of mean QOL. X axis represents the four QOL domains using the WHOQOL-BREF. Y axis represents the mean domain scores (%).

Mean domain scores as determinants of mean QOL. X axis represents the four QOL domains using the WHOQOL-BREF. Y axis represents the mean domain scores (%).