Figure 3.

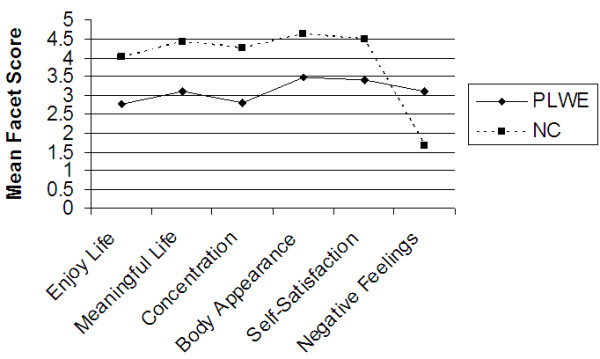
Facets determining the psychological QOL domain. X axis represents the six facets that comprise the psychological QOL domain. Y axis represents the mean facet score (0 to 5).

Facets determining the psychological QOL domain. X axis represents the six facets that comprise the psychological QOL domain. Y axis represents the mean facet score (0 to 5).