
Figure 5.
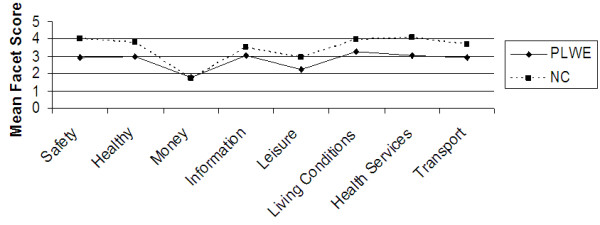
Facets determining the environmental QOL domain. X axis represents the eight facets that comprise the environmental QOL domain. Y axis represents the mean facet score (0 to 5).
Official websites use .gov
A
.gov website belongs to an official
government organization in the United States.
Secure .gov websites use HTTPS
A lock (
) or https:// means you've safely
connected to the .gov website. Share sensitive
information only on official, secure websites.
Facets determining the environmental QOL domain. X axis represents the eight facets that comprise the environmental QOL domain. Y axis represents the mean facet score (0 to 5).