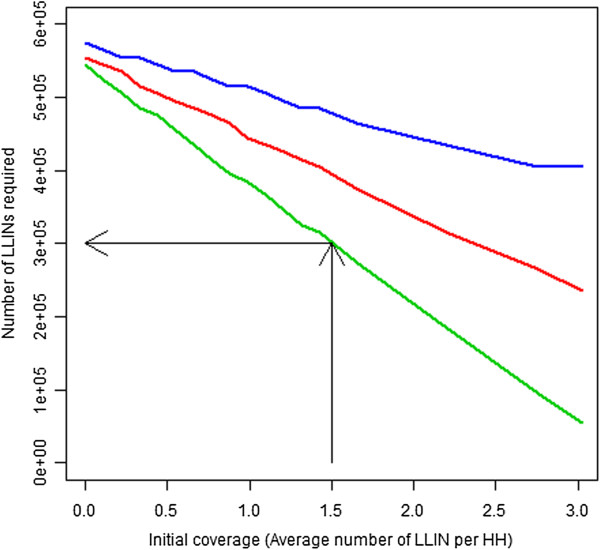
Figure 3.

Numbers of LLINs required to reach 90% coverage for varied initial coverage and times since survey. Legend: This chart illustrates the numbers of LLINs that would be required to reach 90% household ownership of at least one LLIN in more than 80% of simulations for a given scenario with a mass campaign that accounts for existing LLINs at varied initial LLIN coverage levels and for campaigns conducted at varying times following the initial coverage survey. All simulations were conducted with a starting population of 1 million persons and an average household size of 5.5: Green line represents one year after the survey, red line two years after survey and blue line three years. One thousand simulations were conducted for each data point (combination of initial coverage estimate and delay until campaign). The black lines are intended as an aid to demonstrate interpretation (showing that for a campaign planned one year after the survey which showed an initial coverage of 1.5 LLIN per household the expected numbers of LLINs required in to reach a specified coverage level).
