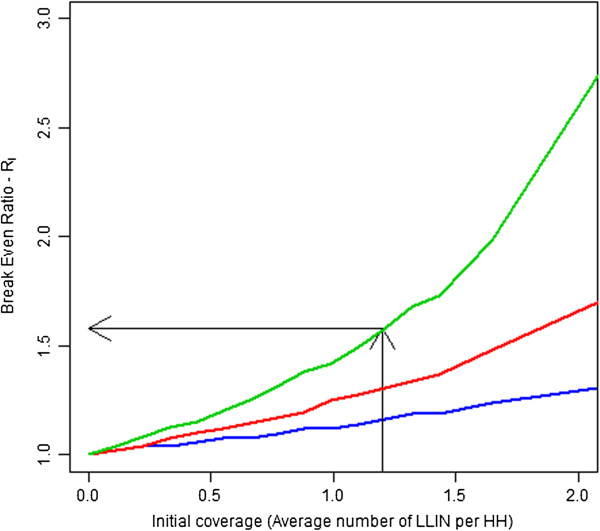
Figure 4.

Break even ratio under ideal conditions as initial coverage is varied. Legend: Break even ratio is shown for three levels of length of time since the coverage survey was conducted. Survey one year prior shown in green, two years prior shown in red, and three years prior shown in blue.
