
Figure 5.
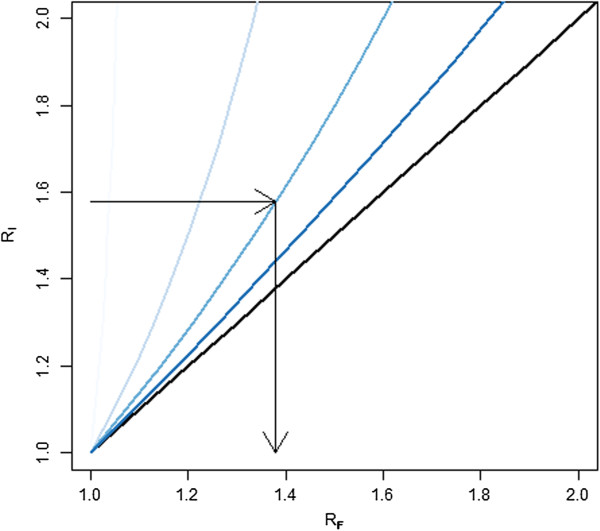
The relationship between RF and RIfor varying levels of F. Legend: F (feasibility) of 10%, 50% 75% and 90% shown from light to dark. Line in black shows ratio of one, RF = RI, representing a scenario in which all nets are found RI is the break even ratio under ideal conditions and RF is the break even ratio when feasibility is considered. Arrows represent the relationship between an RI and RF when RI = 1.6 and F = 0.75.