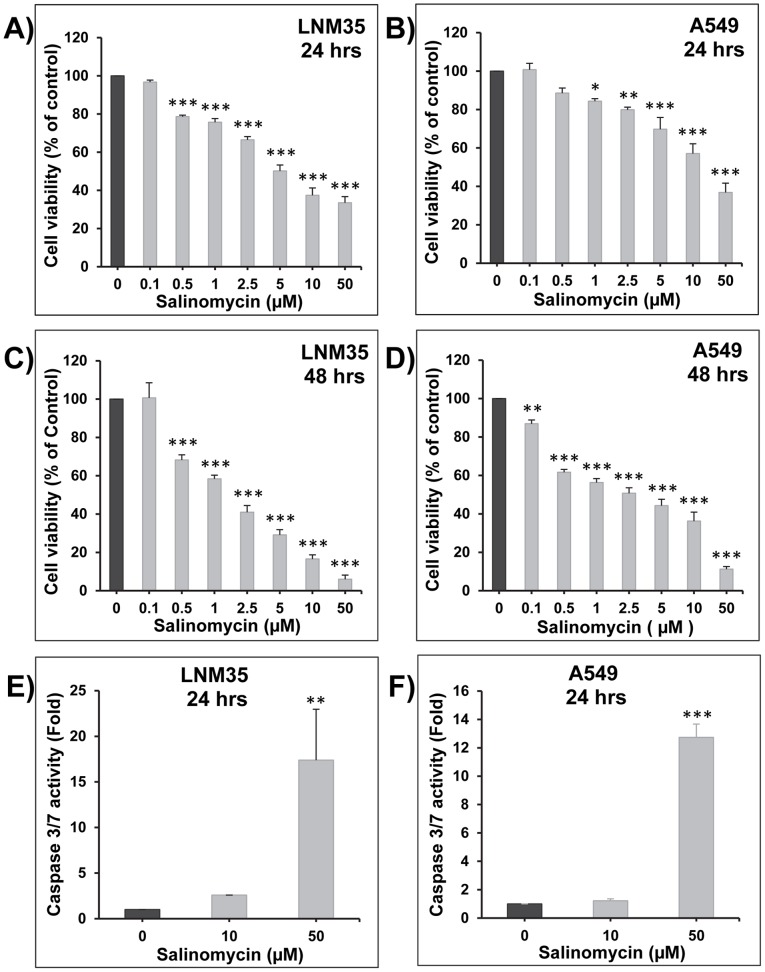
Figure 1. Inhibition of cell viability by salinomycin.
Exponentially growing LNM35 (A, C) and A549 (B, D) cells were treated with vehicle (0.1% DMSO) or the indicated concentrations of salinomycin. The left panel represents 24 h exposure, while the right panel represents 48 h exposure. Viable cells were assayed as described in Materials and Methods. Induction of caspase-3/7 activity was analyzed in LNM35 (E) and A549 (F) cells treated for 24 h with salinomycin (10 and 50 µM), normalized to the number of viable cells per well and expressed as fold induction compared with the control group. All experiments were repeated at least three times. *Significantly different at P<0.05, **Significantly different at P<0.01, ***Significantly different at P<0.001.

