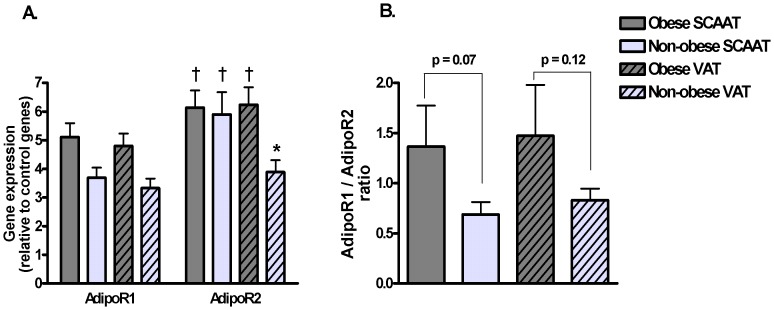
Figure 4. Gene expression of AdipoR1 and AdipoR2 in SCAAT and VAT of obese and non-obese subjects.
(A) Relative gene expression of AdipoR1 and AdipoR2 in SCAAT and VAT of obese and non-obese subjects as the ratio of the gene of interest expression/geometric mean of the expression of three control genes (ACTB, RPLP0, PPIA). (B) Ratio of AdipoR1/AdipoR2 relative expression in SCAAT and VAT of both groups. N = 9 for obese and N = 6 for non-obese subjects * p<0.05 for comparison between SCAAT and VAT, † p<0.05 for comparison between AdipoR1 and AdipoR2 expression.

