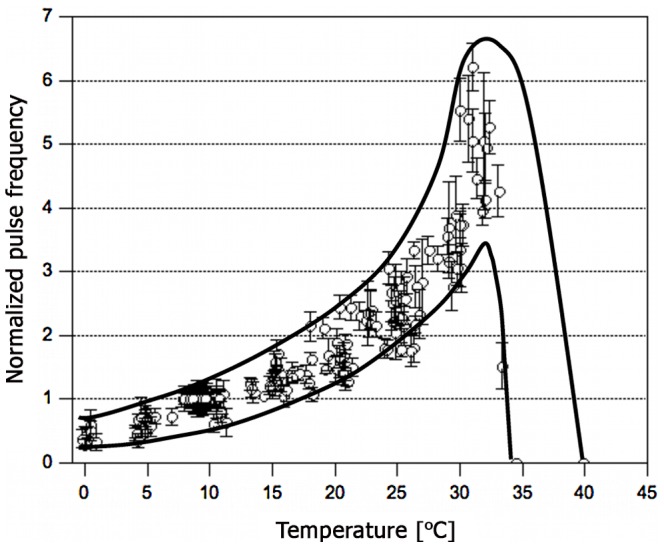
Figure 3. Variation of pulse frequency with environmental temperature.

Data was normalized to each individual worm’s pulse frequency at 9.3±0.7°C (average: 4.4±0.8 beats min−1). The black envelopes are guides to the eye. Each data point represents the average of six measurements. Number of worms studied = 68.
