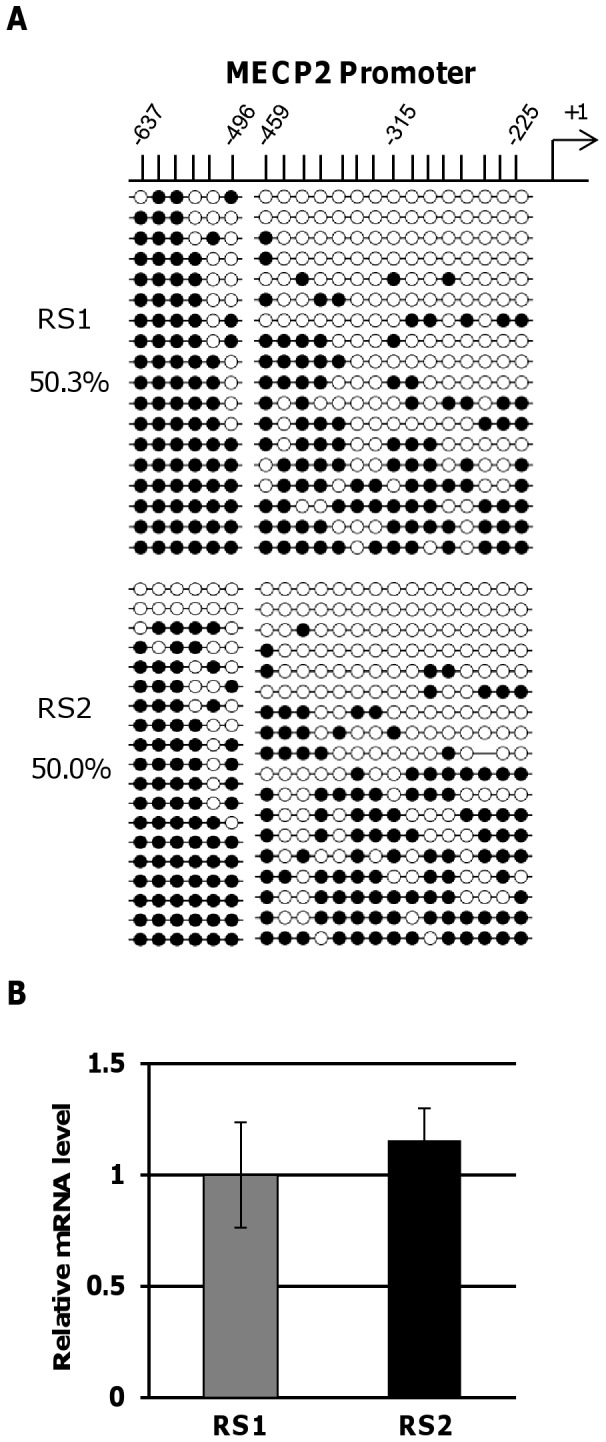
Figure 3. DNA methylation and expression analyses for the MECP2 gene.

(A) DNA methylation profile in the upstream region of MECP2 by bisulfite sequencing. The upper number indicates the position of the CpG from the transcription start site of MECP2. (B) Results of a qRT-PCR assay for MECP2 gene.
