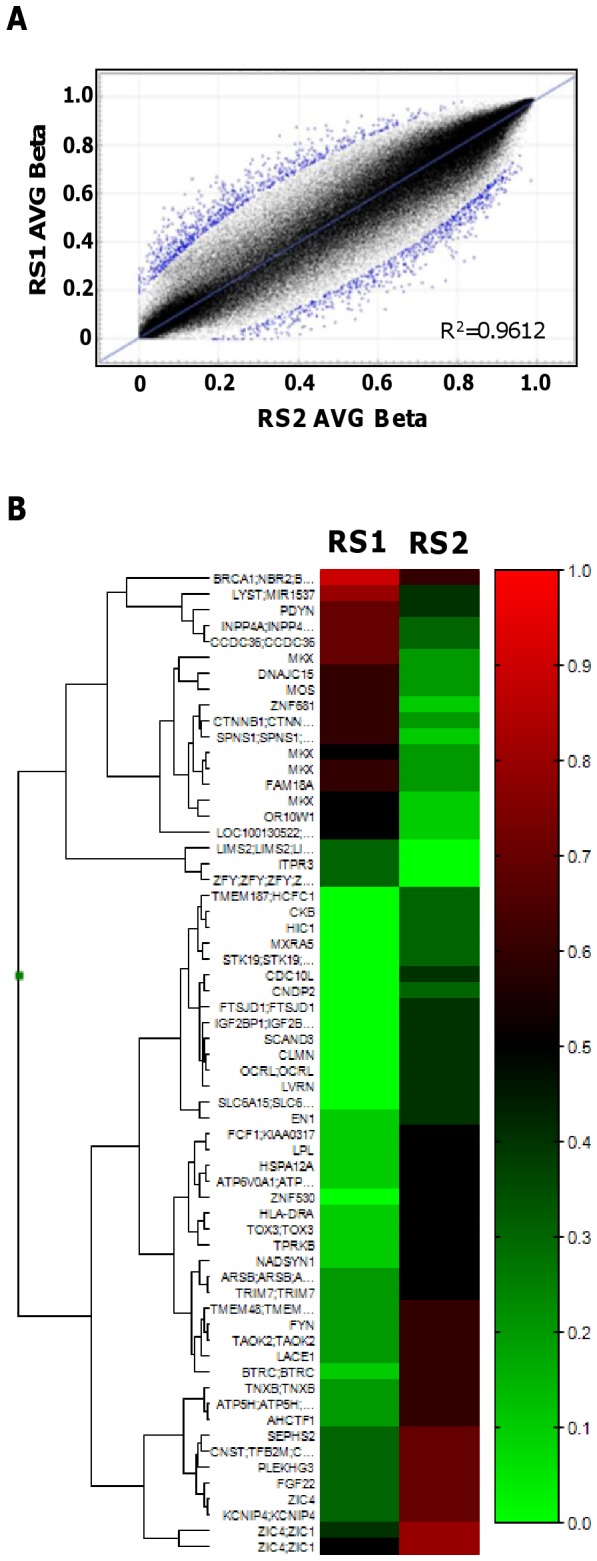
Figure 4. Results of genome-wide analysis of DNA methylation in the twins.

(A) Correlation of DNA methylation at the CpG sites analyzed between the twins based on an average (AVG) beta value. (B) Differentially methylated CpG sites between the twins. Red indicates hypermethylation and green indicates hypomethylation.
