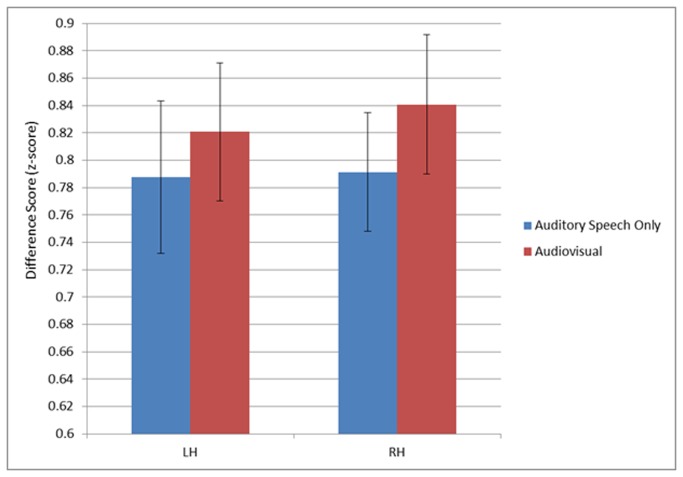
Figure 5. Graph showing the mean difference scores with 95% confidence intervals from voxels in auditory cortex.
There was a significant main effect of condition (N=14, p=0.02). Mean values are computed as the average of the z-score at each timepoint minus the minimum z-score for each condition in each hemisphere.

