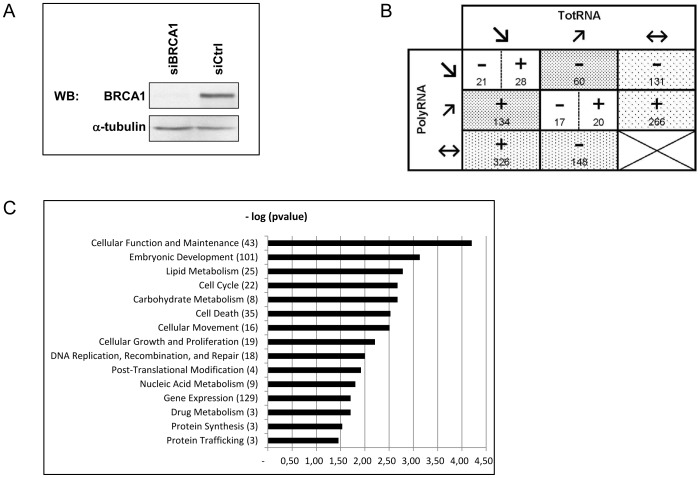
Figure 2. Microarray analysis of polysome-associated RNAs from MCF7 cells in which BRCA1 has been depleted.
A/Western blot confirming siRNA inhibition of BRCA1 levels in MCF7 cells when compared with control siRNA. Immunoblotting for BRCA1 used 8F7 antibody. α-tubulin served as loading control. B/Number of mRNAs exhibiting altered translational efficiency in BRCA1-depleted MCF7 cells compared to control MCF7 cells. The 1151 mRNAs displaying a modified relative translatability (RR = polyRNA/totRNA) were clustered in several groups depending on their fold change in polysomal RNA abundance (PolyRNA) and their fold change in total mRNA abundance (TotRNA). The fold changes in polysomal RNA abundance and in total mRNA abundance are indicated as follows:  ≤0.67, (↗)≥1.50, (↔) >0.67 and <1.50. The RRs are annotated with a sign and a number. The sign specifies the RR value: (−) ≤0.67, (+) ≥1.50. The number indicates how many mRNAs are deregulated.
  : mRNAs translationally deregulated through change in polysome mRNA abundance only;
  : mRNAs translationally deregulated through change in total mRNA abundance only;
  : mRNAs translationally deregulated through change in polysome abundance together with opposite changes in total mRNA C/Functional distribution of differentially translated known genes in BRCA1-depleted versus control MCF7 cells. Gene functions were established based on the annotation provided by the IPA database. The number of genes enriched in each function is shown in brackets.

