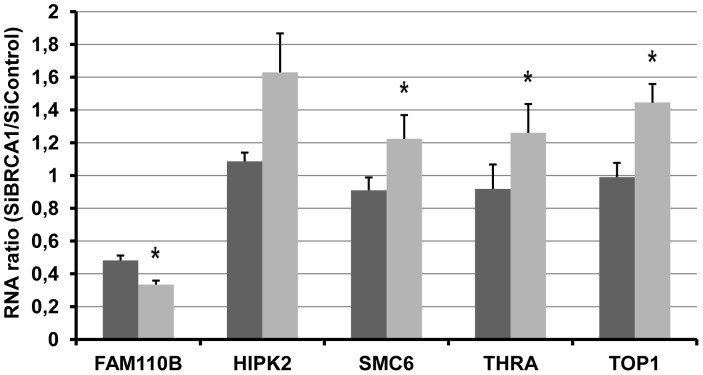
Figure 3. RT-qPCR analyses of differentially translated mRNAs upon BRCA1 depletion.
Total RNA and polysomal-associated RNA from MCF7 cells transfected with BRCA1-targetting siRNA or control siRNA were reverse transcribed and five transcripts identified in the microarray analysis were quantified by real time PCR. qPCR analysis was performed in triplicate. Analysis of mRNA levels for each target was normalized to HPRT1 mRNA. For each gene, the polyRNA (grey) and the totalRNA (black) Ratios were determined using the ΔΔCt calculation method. Results are representative of the average RNA ratio ± SEM from four independent experiments. *, p<0.05 compared with SiControl.

