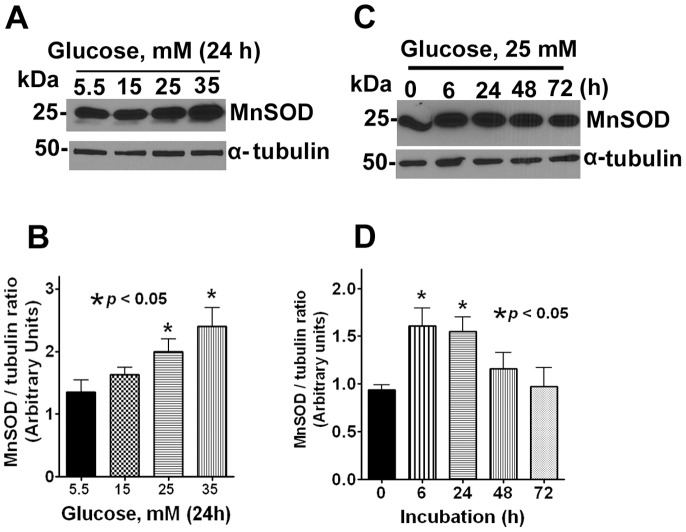
Figure 5. Hyperglycemic conditions diminished the expression of MnSOD.
A. Representative Western blots data showing the expression of MnSOD in lens epithelial cells treated with different doses of glucose for 24 h. The α-tubulin served as loading control. B. Densitometric analysis of the Western blot obtained in three independent experiments. The results are expressed as mean ± SD. C. Representative Western blots showing the expression of MnSOD in lens epithelial cells treated with 25 mM of glucose at different time points. The α-tubulin served as loading control. D. Densitometric analysis of the Western blot obtained in three independent experiments.

