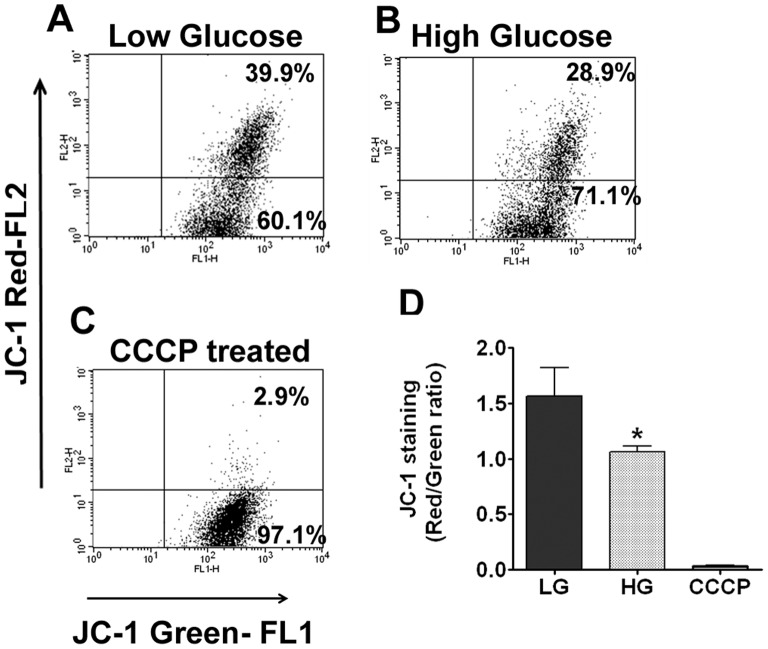
Figure 6. Hyperglycemic conditions decrease the mitochondrial membrane integrity.
A–C: Representative flow cytometry histogram showing JC-1 staining after treatment with low glucose, high glucose and CCCP-treatment (positive control). D. Graph showing significant reduction of mitochondrial membrane integrity in cells treated with high glucose. The arbitrary units indicate the ratio of red/green fluorescence. The shift from red to green indicates the mitochondrial membrane depolarization.

