
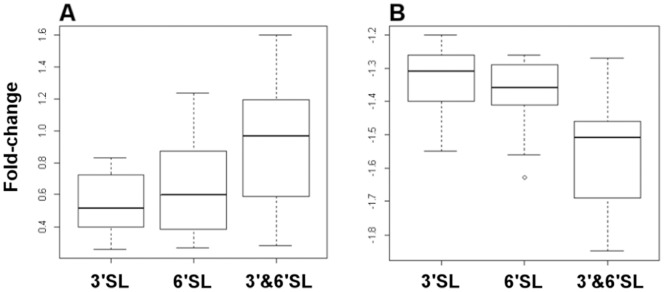
Figure 6. Boxplot representation of the fold-change in expression for the genes up-regulated (A) and down-regulated (B) by all three treatments.
Official websites use .gov
A
.gov website belongs to an official
government organization in the United States.
Secure .gov websites use HTTPS
A lock (
) or https:// means you've safely
connected to the .gov website. Share sensitive
information only on official, secure websites.