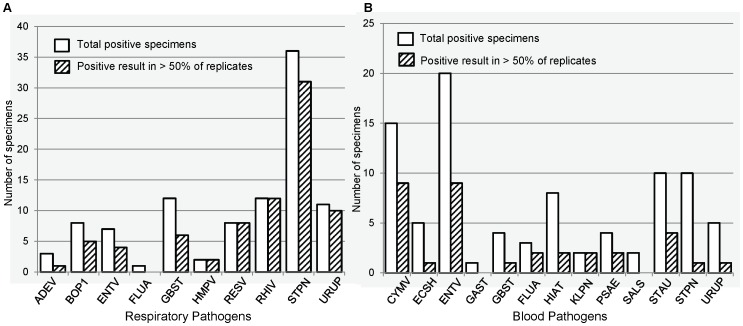
Figure 3. Concordance between replicates of primary clinical specimens tested on TAC.
Concordance between replicate results for NP/OP (A) and blood (B) specimens tested using TAC. Data shown are total number of specimens identified as positive in at least one replicate reaction (white bars) and proportion of positive specimens for which greater than 50% of replicates were positive (shaded bars). Number of replicates tested varied by target and specimen type; all targets were tested in ≥2 replicates. Total number of specimens tested, NP/OP (n = 124), blood (n = 661).

