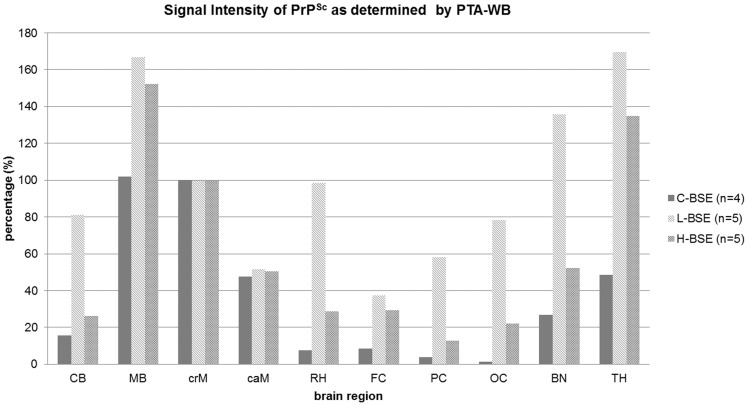
Figure 4. Signal Intensity of PTA-WB signals.
Western blot signals were measured with a digital camera (VersaDoc™) and evaluated with the respective software (Quantity One®, BioRad, Munich, Germany). The arithmetic means were calculated for the individual BSE types. Cranial medulla was set as the reference (100%) and the other brain regions were set in relation to it. CB – cerebellum, MB – midbrain including pons, crM – cranial medulla oblongata, caM – caudal medulla oblongata, RH – rhinencephalon (olfactory bulb), FC – frontal cortex, PC – parietal cortex, OC – occipital cortex, BN – basal nuclei, TH – thalamus.

