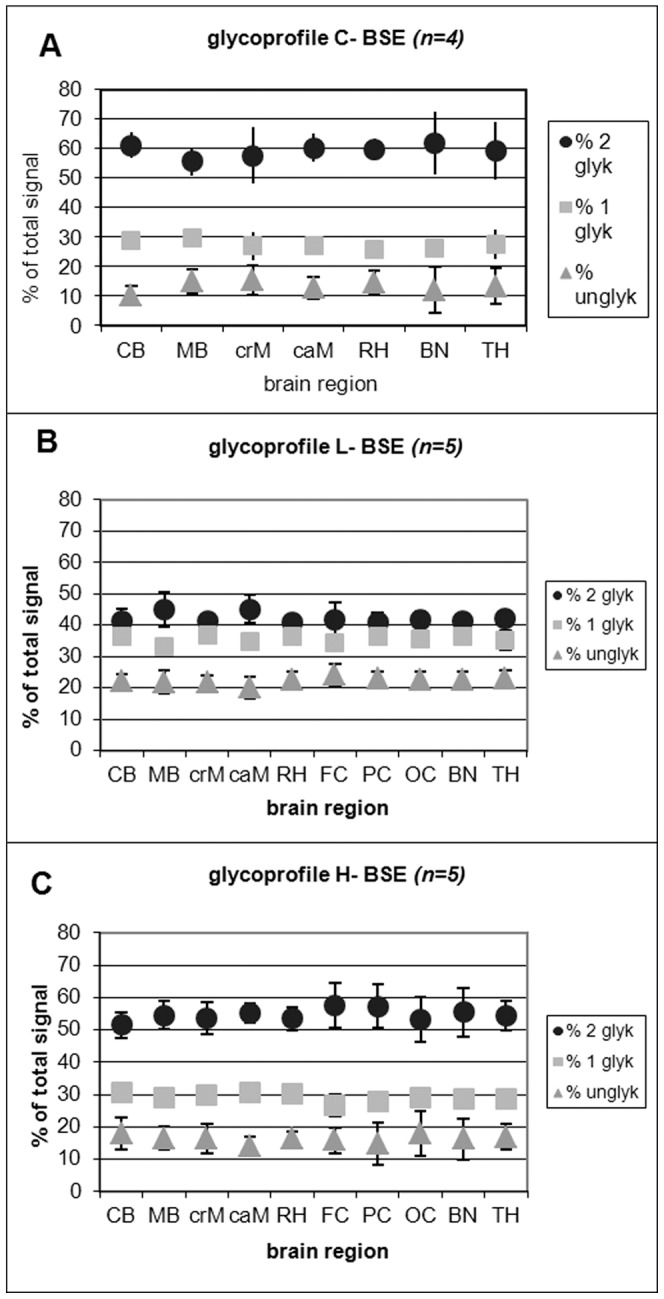
Figure 5. ‘Glycoprofile’ analysis of C-, L- and H-type BSE.

The relative quantity of the three PrPSc bands was determined using the Quantity One® Software after background subtraction for the glycosylation profile analysis (percentage of the di-, mono- and unglycosylated PrPSc band). All values were calculated as means ± standard deviations of four SDS-PAGE runs. Since it was not possible for classical BSE to detect the TSE-associated PrPSc triplet banding pattern after PK digestion in the three cortex regions, these regions could not be evaluated. (A) the glycoprofile of the classical BSE (C-type BSE), (B) the glycoprofile of the L-type BSE and (C) the glycoprofile of the H-type BSE. CB – cerebellum, MB – midbrain including pons, crM – cranial medulla oblongata, caM – caudal medulla oblongata, RH – rhinencephalon (olfactory bulb), FC – frontal cortex, PC – parietal cortex, OC – occipital cortex, BN – basal nuclei, TH – thalamus.
