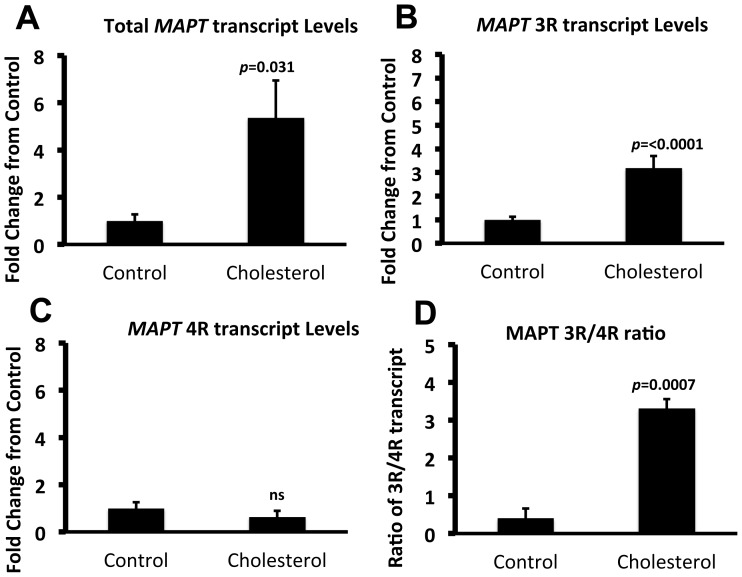
Figure 8. Total MAPT and MAPT3R transcripts are up-regulated under cholesterol fed conditions.
Quantitative PCR analysis shows that, in comparison to animals fed a control diet, guinea pigs fed a cholesterol rich diet showed a significant increase in (A) total MAPT (p = 0.031, t = 3.560, d.f. = 14) and (B) MAPT3R (p<0.0001, t = 6.468, d.f. = 14) transcripts but (C) no change was observed in MAPT4R transcripts (p = 0.1320, t = 1.60, d.f. = 14, ns). An increased 3R/4R ratio was observed (p = 0.0007, t = 4.326, d.f. = 14). Data is represented as fold change from control fed animals. Transcript levels were normalised against RPS16. Data represents ± SEM.

