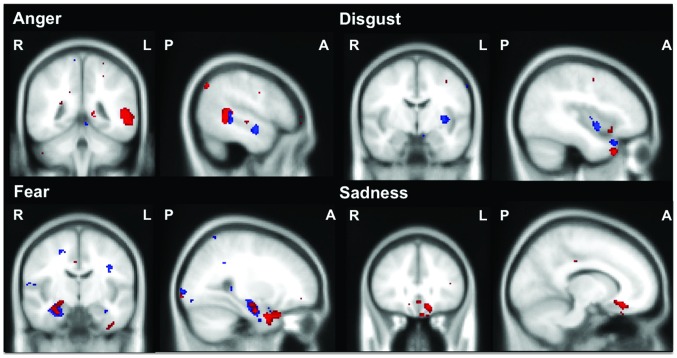
Figure 2. Brain regions correlated with negative emotion recognition on the Ekman 60 (Red) and Caricatures (Blue).
Voxel-based morphometry analyses showing common brain regions in which grey matter intensity in all participants combined correlated significantly with emotion recognition for each basic emotion on the Ekman 60 (Red) and Caricatures (Blue) tasks. MNI coordinates: Anger: x = –52, y = –44, z = –6; Disgust: x = –40, y = –6, z = –32; Fear: x = 28, y = –10, z = –10; and Sadness: x = –12, y = 30, z = –16. Coloured voxels show regions that were significant in the analyses with p<.001 uncorrected for all contrasts. Age included as a nuisance variable for all contrasts. All clusters reported t>3.95. Clusters are overlaid on the Montreal Neurological Institute standard brain. R = right, L = left, P = posterior, A = anterior.

