
Figure 1. EOD signal measurement and ideal dipole approximation.
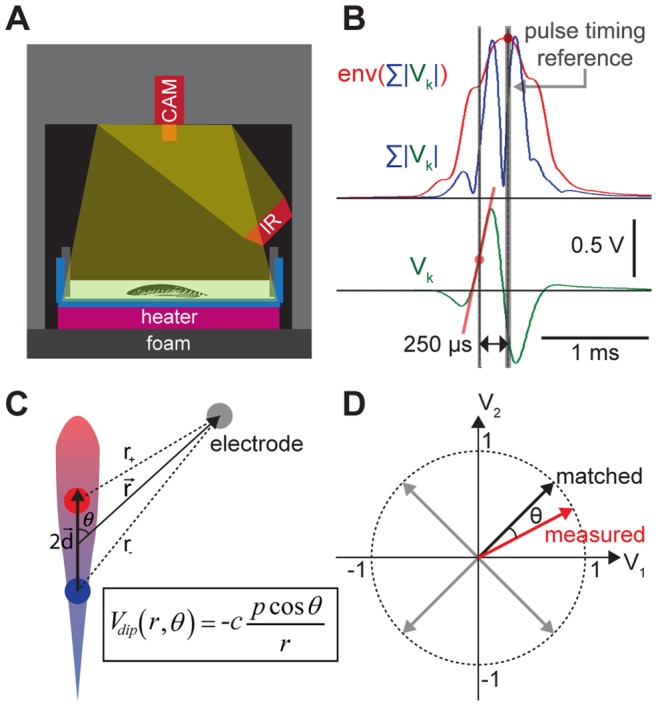
A) Our experimental setup. Electrodes were attached on the tank wall, and concurrent video recordings were made under infrared illumination. B) Received signal intensity (RSI) measurement. The original waveforms (green) were rectified then summed from all channels (blue). Signal envelope (red curve) was extracted using an RMS filter, and a pulse timing reference (thick grey) was determined at the peak. An instantaneous slope of the original waveform was measured at 250 µsec before the reference timing (red line). C) Ideal dipole voltage (Vdip) approximation of an electric fish in two dimensions. D) Lookup table search using a dot-product to find the best matching vector.