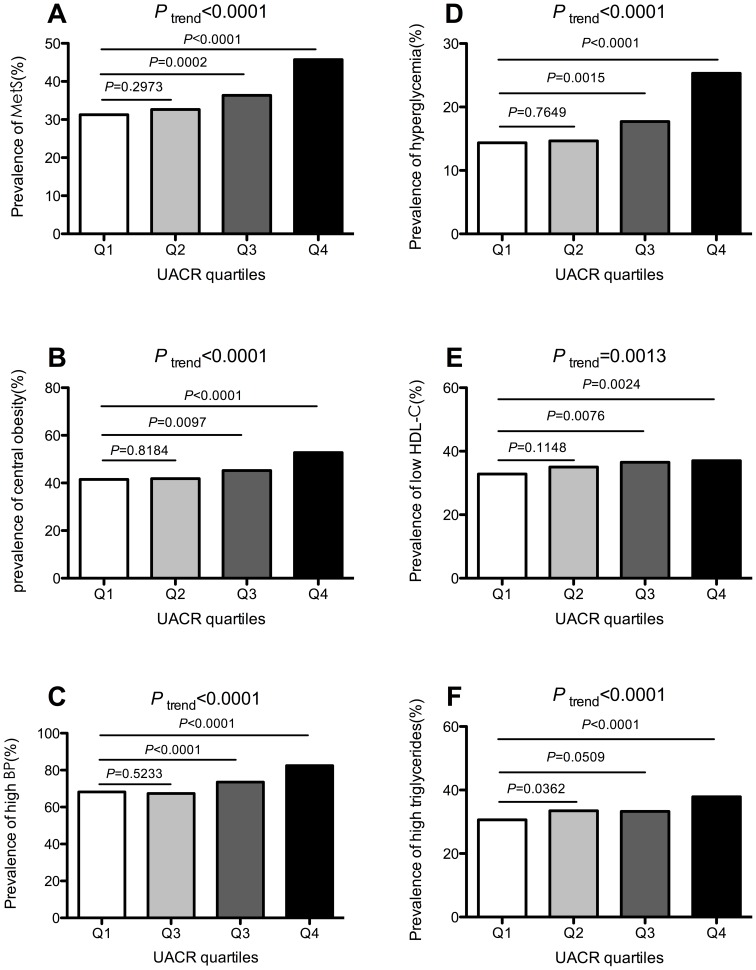
Figure 1. Prevalence of MetS (Panel A), central obesity (Panel B), high BP (Panel C), hyperglycemia (Panel D), low HDL-C (Panel E), high triglycerides (Panel F) in different UACR quartiles; UACR quartiles cut-off points for male:
0 mg/g<Q1<2.28 mg/g, 2.28 mg/g ≤Q2<3.67 mg/g, 3.67 mg/g≤Q3<6.21 mg/g, 6.21 mg/g≤Q4<30.00 mg/g; and for female: 0 mg/g<Q1<3.09 mg/g, 3.09 mg/g ≤Q2<5.22 mg/g, 5.22 mg/g≤Q3<8.81 mg/g, 8.81 mg/g≤Q4<30.00 mg/g); P values and P trend were calculated from CMH chi-square tests. Panel A: The prevalence was 31.3, 32.7, 36.4 and 45.7% for MetS from the lowest to the highest UACR quartile, respectively. Panel B: The prevalence was 41.5, 41.9, 45.2 and 52.8% for central obesity from the lowest to the highest UACR quartile, respectively. Panel C: The prevalence was 68.2, 67.3, 73.5 and 82.5% for high BP from the lowest to the highest UACR quartile, respectively. Panel D: The prevalence was 14.4, 14.7, 17.7 and 25.3% for hyperglycemia from the lowest to the highest UACR quartile, respectively. Panel E: The prevalence was 32.9, 35.0, 36.5 and 37.0% for low HDL-C from the lowest to the highest UACR quartile, respectively. Panel F: The prevalence was 30.6, 33.5, 33.3 and 37.9% for high triglycerides from th lowest to the highest UACR quartile, respectively.

