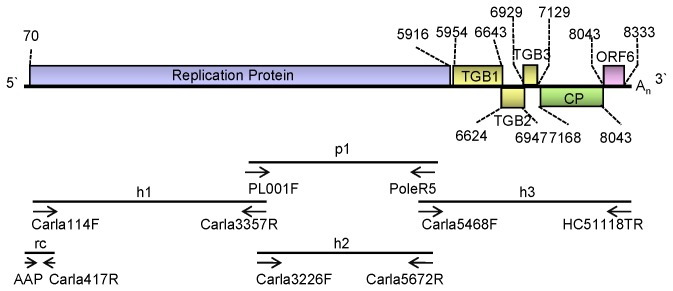
Figure 1. Genomic organization of PVH.
(A) Schematic diagram of the PVH genome. The solid line represents the RNA genome and the boxes represent the ORFs. The putative protein products are indicated. (B) Genome cloning strategy and locations of the cDNA clones used for PVH sequencing: p1 represents the RT-PCR-generated sequence using the degenerate primer during the detection of Potato leafroll virus; h1, h2 and h3 represent RT-PCR-generated sequences using degenerate primers specific to carlaviruses and PVH specific primers based on the p1 sequence; rc is the 5-terminal clone generated by 5' rapid amplification of cDNA ends. The sequences of the primers are shown in Table 1.

