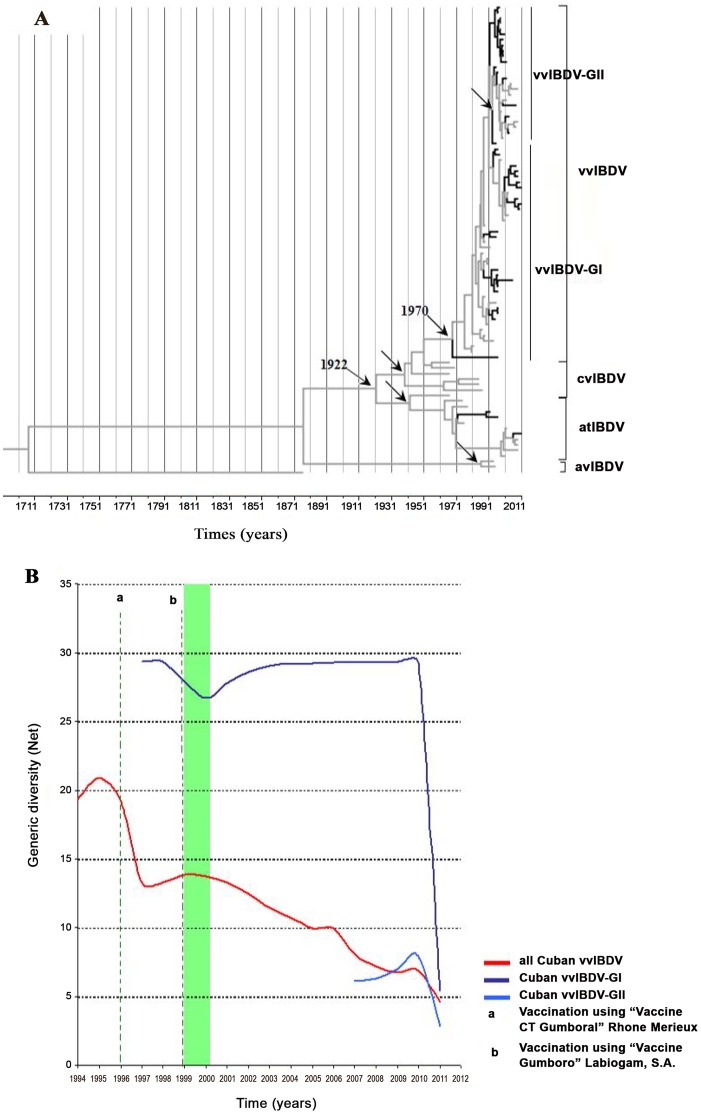
Figure 2. Phylodynamics of IBDV.
The left panel A) describes a maximum clade credibility (MCC) analysis performed using BEAST (Drummond et al., 2012), with the evolutionary history of the HVR-VP2 sequences dataset shown. The branches belonging to Cuban sequences were highlighted in black. The internal nodes of cvIBDV, atIBDV, avIBDV and vvIBDV were denoted using black arrows and the most probable year for the MRCA of vvIBDV was also denoted. The right panel B) shows a Bayesian skyline plot (BSP) representing the relative genetic diversity of circulating Cuban vvIBDV over time. In addition, a BSP to differentiate the genetic diversity of the two different groups of vvIBDV found circulating in Cuba was also shown. Different colours were used to distinguish each population (red line: all Cuban vvIBDV strains, blue line: Cuban vvIBDV included in group I and sky-blue line: Cuban vvIBDV included in group II). For clarity, only the mean population sizes over time were plotted. The starting period for the vaccination program supported by serological test was highlighted by a green shadow.

