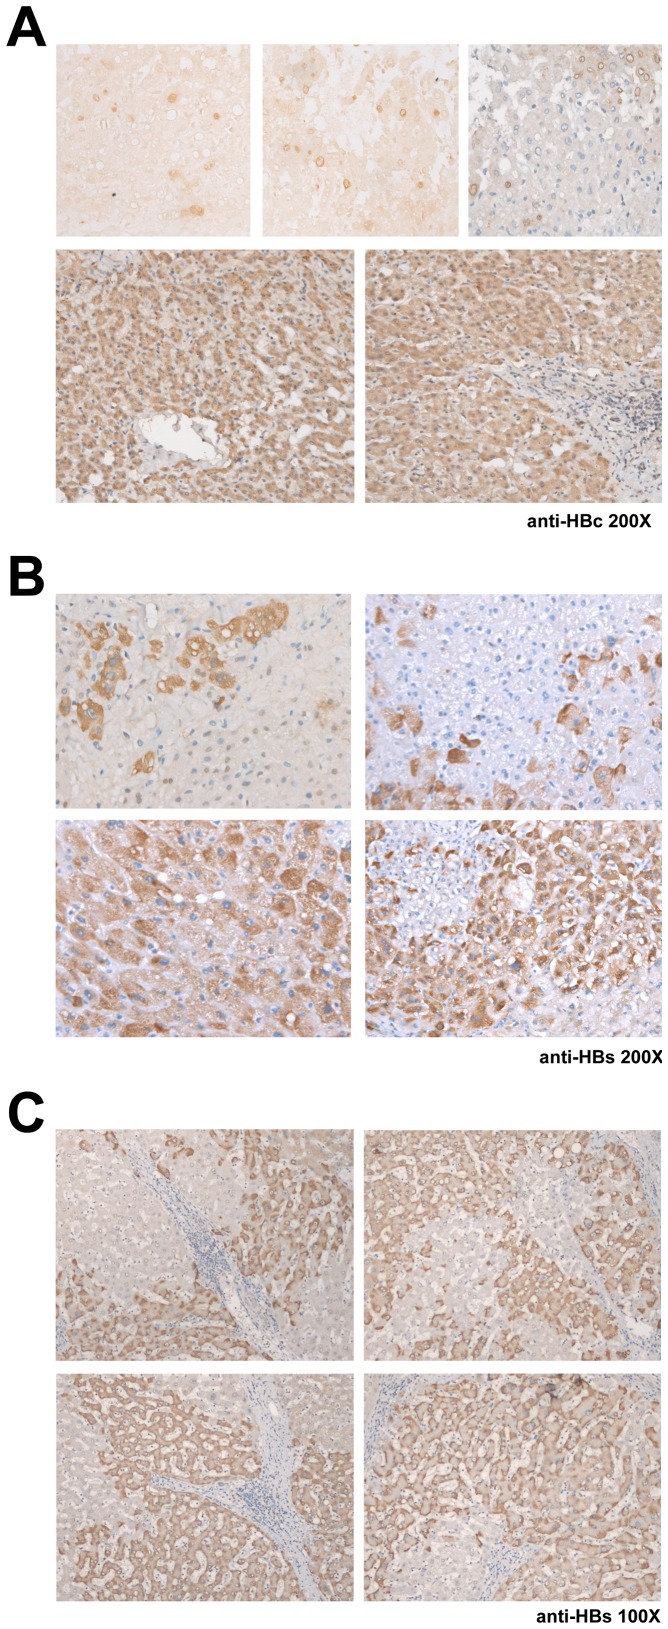
Figure 3. Representative immunohistochemistry results in HCV-associated HCC patients with occult HBVCI.
(A) Tissue expression of HBcAg (200X). Upper panels from left to right: scattered distribution of nuclear staining (without counter stain), scattered distribution of nuclear membranous staining (without counter stain), and both nuclear and nuclear membranous staining (with counter stain). Lower panels, diffuse cytoplasmic staining. (B) Tissue expression of HBsAg (200X). Upper panels, scattered distribution of cytoplasmic staining. Lower panels, diffuse distribution of cytoplasmic staining. (C) Tissue expression of HBsAg (100X). Regional distribution of sub-membranous staining pattern.

