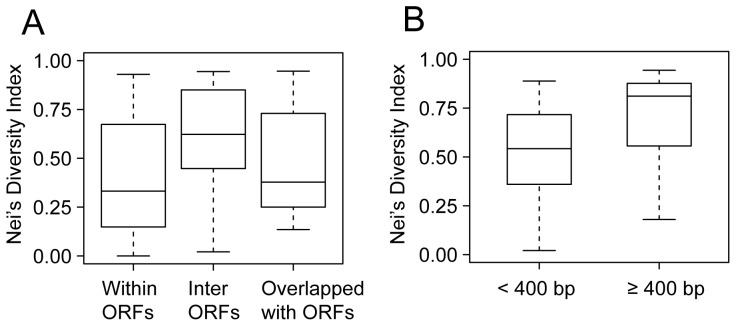
Figure 2. Nei’s DI across VNTRs in different genomic positions.
A. DIs across three groups of 88 VNTRs according to their relative position to ORFs. B. DIs of 48 VNTRs located between ORFs. The two groups were defined by their distance to the 5′-end of the downstream ORF. Box plot indicates median (horizontal line), interquartile range (box), and minimum and maximum values (whiskers).

