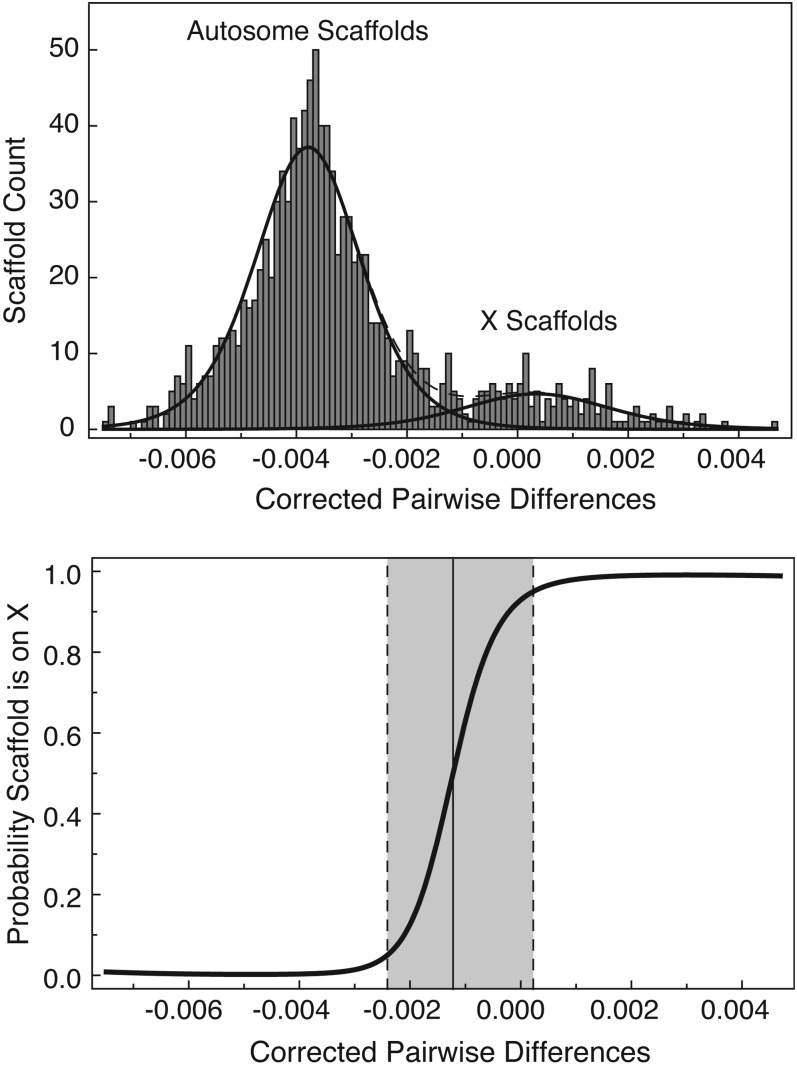
Figure 3.
The distribution of the corrected pairwise difference and the associated probability that a scaffold is on the X chromosome. The top panel shows the frequency of scaffolds with a given corrected pairwise difference. The lines represent the fitted models. The bottom panel shows the probability of a scaffold being on the X chromosome as a function of the corrected pairwise difference. The dotted lines indicate the 0.05 and 0.95 probability values and the solid line represents the 0.5 probability value.

