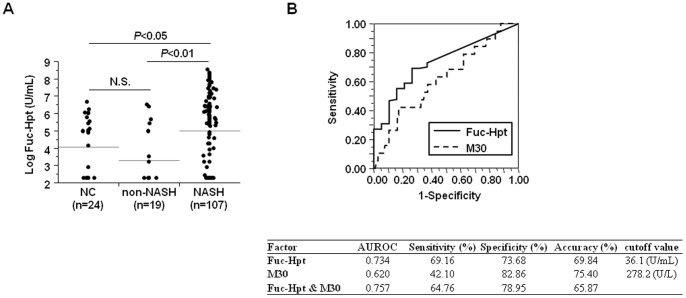
Figure 1. Serum Fuc-Hpt levels were significantly elevated in biopsy-proven NASH patients.
(A) Serum Fuc-Hpt levels in each group (normal controls, non-NASH patients, NASH patients). Horizontal grey lines indicate the mean values of Fuc-Hpt in each group. NC, normal controls. (B) ROC curves for Fuc-Hpt and the M30 antigen for the discrimination of NASH.

