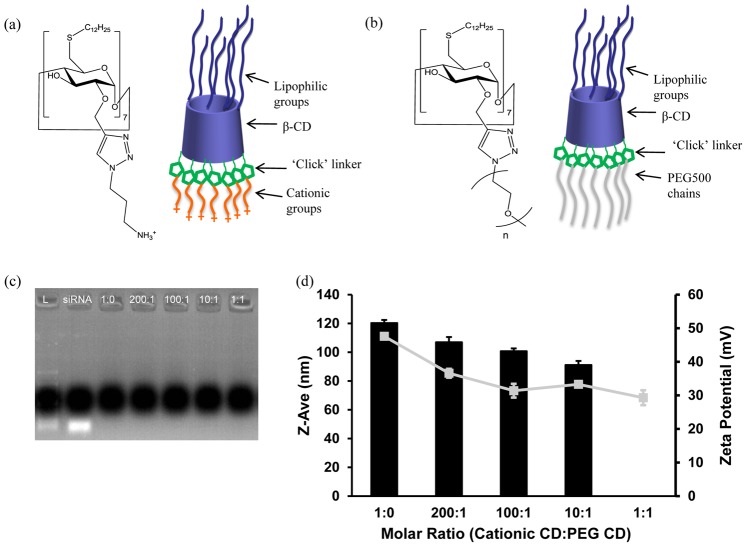
Figure 1. Chemical structures and properties of CDs and complexes.
(a, b) Chemical structures and schematic representations of Cationic CD (a) and PEGylated CD (n = 10–12) (b). (c) Gel electrophoresis showing siRNA binding within co-formulated CD.siRNA complexes. (d) Size (Z-Ave (nm), black bars) and charge (zeta potential (mV), grey square boxes) of co-formulated CD.siRNA complexes. Data are presented as the Mean ± S.D (n = 3).

