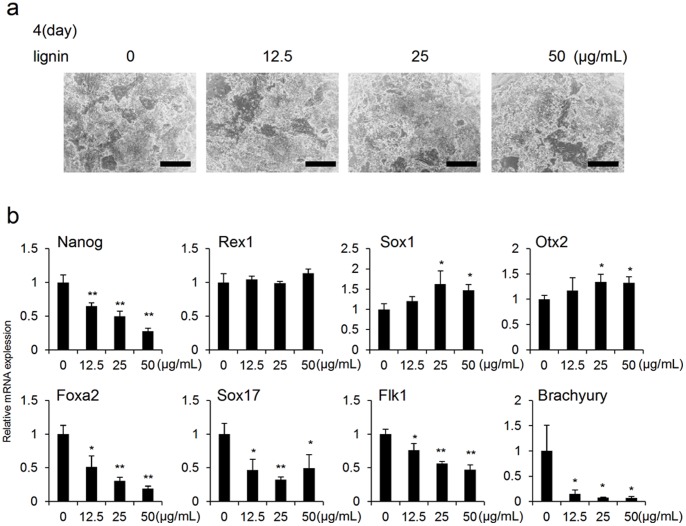
Figure 3. Analysis of the effects of lignin on ES cells cultured in absence of MEF and LIF (MEF−/LIF−).
(a) Microscopic images of ES cells on day 4 of culture. ES cells were cultured with lignin (12.5, 25 and 50 µg/mL). (b) Gene expression analysis by real-time PCR. Changes in the expressions of differentiation marker genes associated with the addition of lignin were analyzed on day 4 of culture. The expression level of each marker gene was normalized to control (0 µg/mL). Scale bar: a = 200 µm. Data are expressed as the mean ± SD of the three experiments. *P<0.05, **P<0.01, compared with the control.

